Monitoring VMware clusters using Prometheus and Grafana

Prometheus and Grafana have always been great opensource tools to monitor every aspect of your environment no matter how detailed you want your information, and no matter the scale of your environment. Prometheus will be gathering the metrics, and Grafana will be presenting the graphs and details you would like to see.
- Prometheus Github — https://github.com/prometheus/prometheus
- Grafana Github — https://github.com/grafana/grafana
In this short blog I will be going through the installation and implementation of these tools in your VMware environment to deliver an efficient and comfortable solution for monitoring.
The files and configurations for this solution could be also found in the next Gitlab repository: https://gitlab.com/michael.kot/esxi-prometheus-grafana
Prerequisites
In the next demo, I’ll be using a RHEL 7.6 VM, the podman tool to perform as the engine for the containers I’ll be running. I’ll be using the podman-compose tool to generate the monitoring environment for the containers.
- You can find information regarding the podman-compose tool in the next Github repository: https://github.com/containers/podman-compose
Before you start, you will need to install the next packages:
sudo yum install -y podman python3
sudo pip3 install pyyaml
Install podman-compose as instructed in the repository: https://github.com/containers/podman-compose
Clone the repository containing the configuration files which represent the monitoring environment:
git clone https://gitlab.com/michael.kot/esxi-prometheus-grafana.gitDeployment
Before we start the deployment, Inspect the docker-compose.yml file:
cat esxi-prometheus-grafana/podman-configuration/docker-compose.yamlversion: "3"
services:
  prometheus_server:
    image: prom/prometheus:v2.17.0
    volumes:
    - type: volume
      source: prometheus_data
      target: /prometheus
    - /opt/prometheus.yml:/etc/prometheus/prometheus.yml
    ports:
    - 9090:9090
    privileged: true

  grafana_server:
    image: grafana/grafana:6.7.2
    volumes:
    - type: volume
      source: grafana_configuration
      target: /etc/grafana
    - type: volume
      source: grafana_data
      target: /var/lib/grafana
    ports:
    - 3000:3000
    privileged: true

  vmware_exporter:
    image: pryorda/vmware_exporter:v0.11.1
    ports:
    - 9272:9272
    environment:
      VSPHERE_HOST: <HOST_IP>
      VSPHERE_IGNORE_SSL: True
      VSPHERE_USER: <USER>
      VSPHERE_PASSWORD: "<PASSWORD>"

volumes:
  prometheus_data:
  grafana_configuration:
  grafana_data:
As you can see the file represents an environment that contains 3 containers:
- prometheus_server: represents the Prometheus host. The Prometheus host will be scraping metrics that contain information regarding the vmware cluster, it will save these metrics in a time series database. By default these metrics will be saved there for 30 days, it is important to save them on a persistent volume, in case the container will shutdown. The Prometheus server will be available at port 9090.
- grafana_server: represents the Grafana host. The Grafana host will be responsible of the visualization part. It will be accessing Prometheus’s time series database, and it will be presenting the metrics in the way you would like to present them. Grafana’s volumes should also be persistent to keep the information there consistent. The Grafana server will be listening at port 3000 by default.
- vmware_exporter: the exporter will be accessing the vmware cluster remotely and gather information from it. The Prometheus server will be scraping the metrics that vmware_exporter exposes. Note that you will need to specify credentials in this section so the exporter will be able to contact the esxi cluster. The exporter will be exposing the metrics on port 9272 by default.
Inspect Prometheus’s configuration file:
cat esxi-prometheus-grafana/prometheus-configuration/prometheus.yml...- job_name: 'vmware_vcenter'
    metrics_path: '/metrics'
    scrape_timeout: 15s
    static_configs:
      - targets:
        - 'localhost:9272'
The job section declares the exporters (agents) which Prometheus has access to. In this case, as you can see, we are declaring a job that connects Prometheus to the vmware exporter.
Make sure that you connect the configuration file to the Prometheus server, if you wish to follow my default configuration, copy it to the /opt directory.
sudo cp esxi-prometheus-grafana/prometheus-configuration/prometheus.yml /optAfter you inspected the configuration, you are ready to deploy the environment! Use the podman-compose utility to bring your environment up.
cd esxi-prometheus-grafana/podman-configuration
sudo podman-compose up -d
Make sure that the containers are running. 3 containers should be up.
sudo podman psTesting the services
Make sure that your metrics are available using the exporter.
http://<IP>:9272/metrics...
vmware_vm_power_state{cluster_name="Cluster_Name",dc_name="Datacenter_Name",host_name="Host_Name",vm_name="VM_Name"} 1.0
...
Make sure that the Prometheus server is up — Through your browser go to http://<IP>:9090
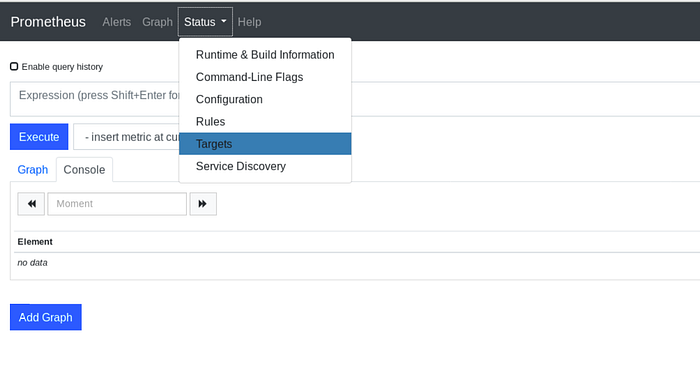
Make sure that the Target is up at:

Make sure that the metrics are available at (under the Graph tab):

Make sure that the Grafana server is up (user: admin, password: admin), Through the browser: http://<IP>:3000

Connect Grafana with Prometheus using Create a data source.

Now, after you have all of your infrastructure ready, you can import a dashboard example from the GitLab repository at:

And you should be all set to go with a brand new dashboard representing your cluster.

Conclusion
The main advantages of integrating Prometheus and Grafana with your vmware cluster are:
- Easy to integrate and configure.
- Very agile and modular. You can design dashboards, graph and show stats in the way you would like to see them.
- Easy to learn and master. The graphs are based on PROMQL which is Prometheus’s query language. The language is simple, and provides you with a large variety of solutions for your graphs — https://prometheus.io/docs/prometheus/latest/querying/basics
- Lightwieght. The monitoring system requires a minimal server with very basic resources.
Try the solution and feel free to comment!
Have fun monitoring!
